Genesys Interactive Insights reports provide a lot of useful reports slicing and dicing into different segments of the Agent groups, resources, etc. It is also able to drill down into lower granular details and drill up. The report documentation is here. There is a good guide on how to customize the reports and the guide provides some sample use cases.
The reports are built based upon the Info mart tables documented here. If there is a requirement to integrate the reports with other data sources, like ServiceNow, to correlate the time spent on each ticket, or the agent’s utilization to be shown on PowerBI or Qlikview, then the reports data need to be extracted.
In order to get the correct query that matches the exact report conditions, there is a simple way to do so in the reports. To do that, go into any report in Interactive Insights, and you should see the Design button as shown:
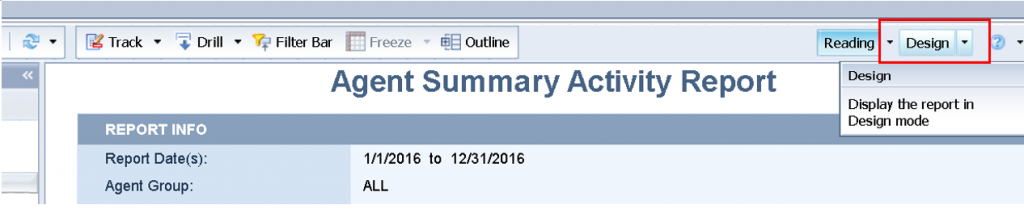
You should be able to drop down that option, if it is grayed out, then you need to look for your administrator to grant you the rights to go into the design mode.
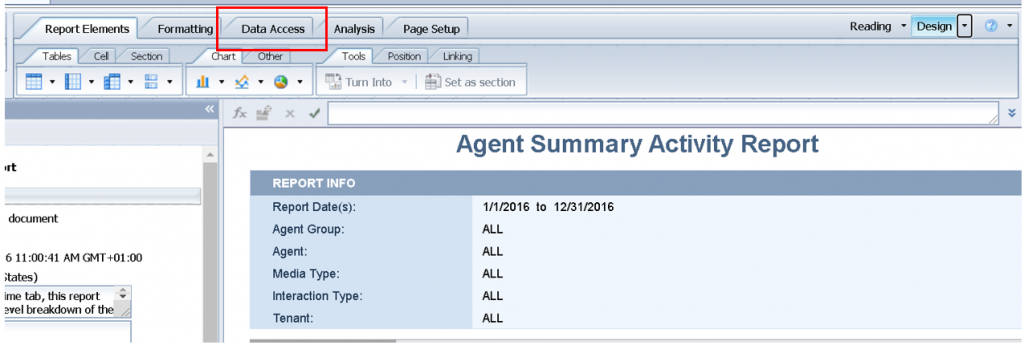
After going into design mode, the top menu bar will be changed with different options. Click on the Data Access.
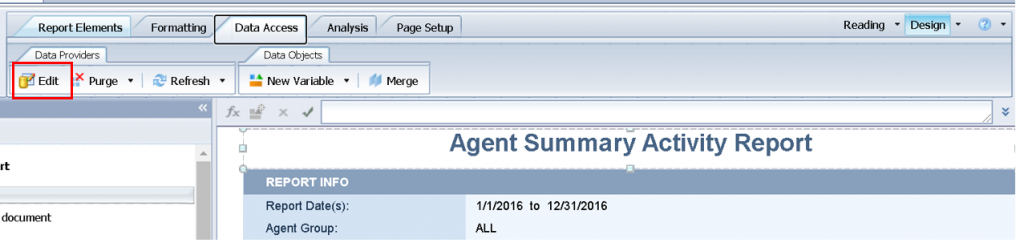
Click on Edit.
A new query panel will pop up. Click on the right most button at the menu bar highlighted below:
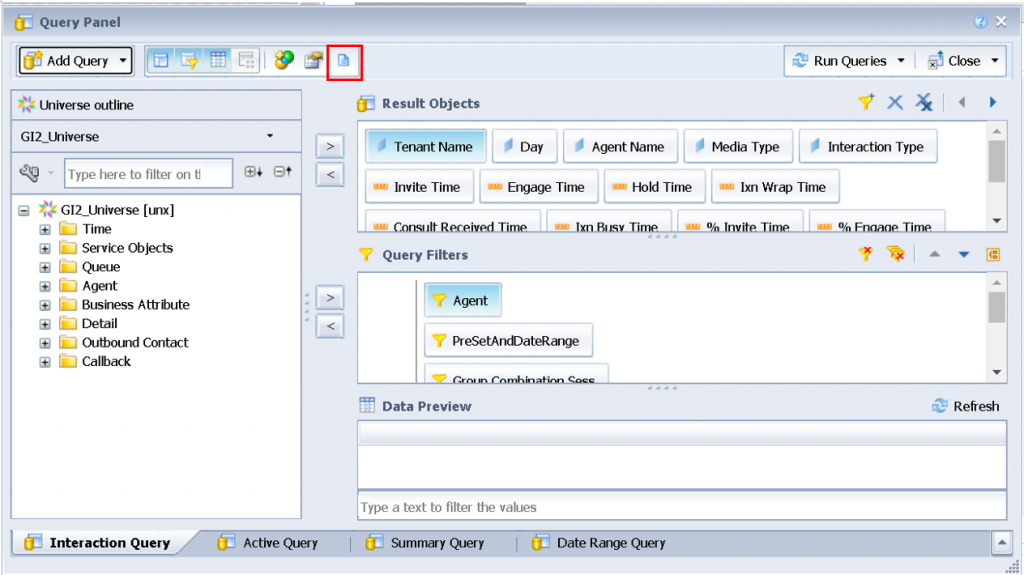
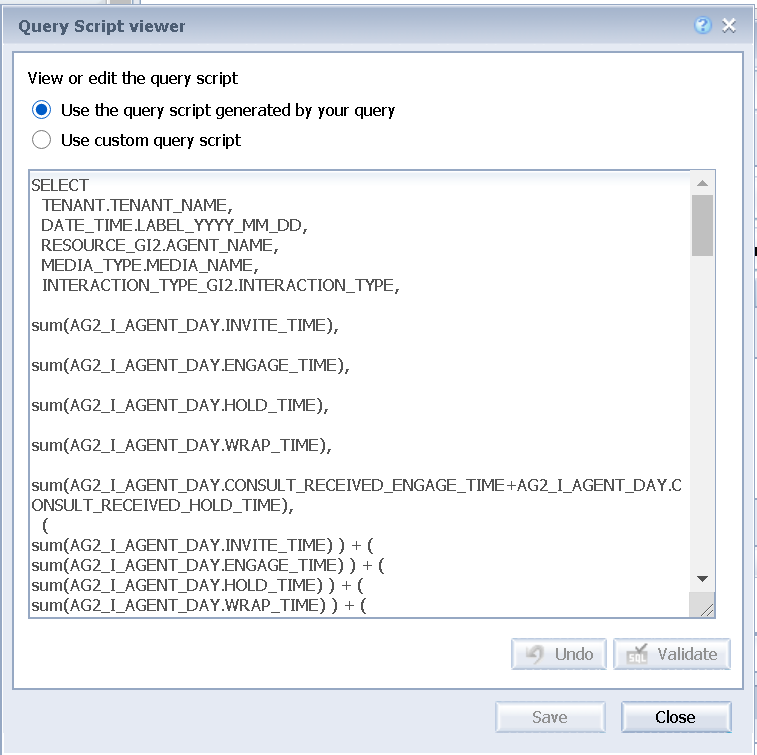
The script will be presented in the Query script viewer as below. You may proceed to copy the query into your favorite query editor and modify accordingly so that you can manipulate it further.
I hope this is useful to you.